CRON, Listing Running Services, Processes and Mounted Devices Lab
Download and Setup Instructions:
Before starting the lab, make sure you downloaded the ZIP file provided to you. When you do that, begin to unzip the file and place the folder wherever appropriate. These following instructions assume you are using a VMware Workstation Client, however most of these instructions are easy to follow no matter what VM client you use.
Go to the File tab in the upper left hand corner of the window, once
you have clicked it, a drop down menu will appear. From there, click on
Open. It should then open up a file explorer, navigate to where you
put your VMs and do either of the following. Click on the
Sprint6_Cyber Patriot.vmx image and it should appear within your
client. If that does not work, click on the Sprint 6_Cyber PatriotVM.ovf, from there it will open up an import menu, where you can
name your VM and choose where to store it.
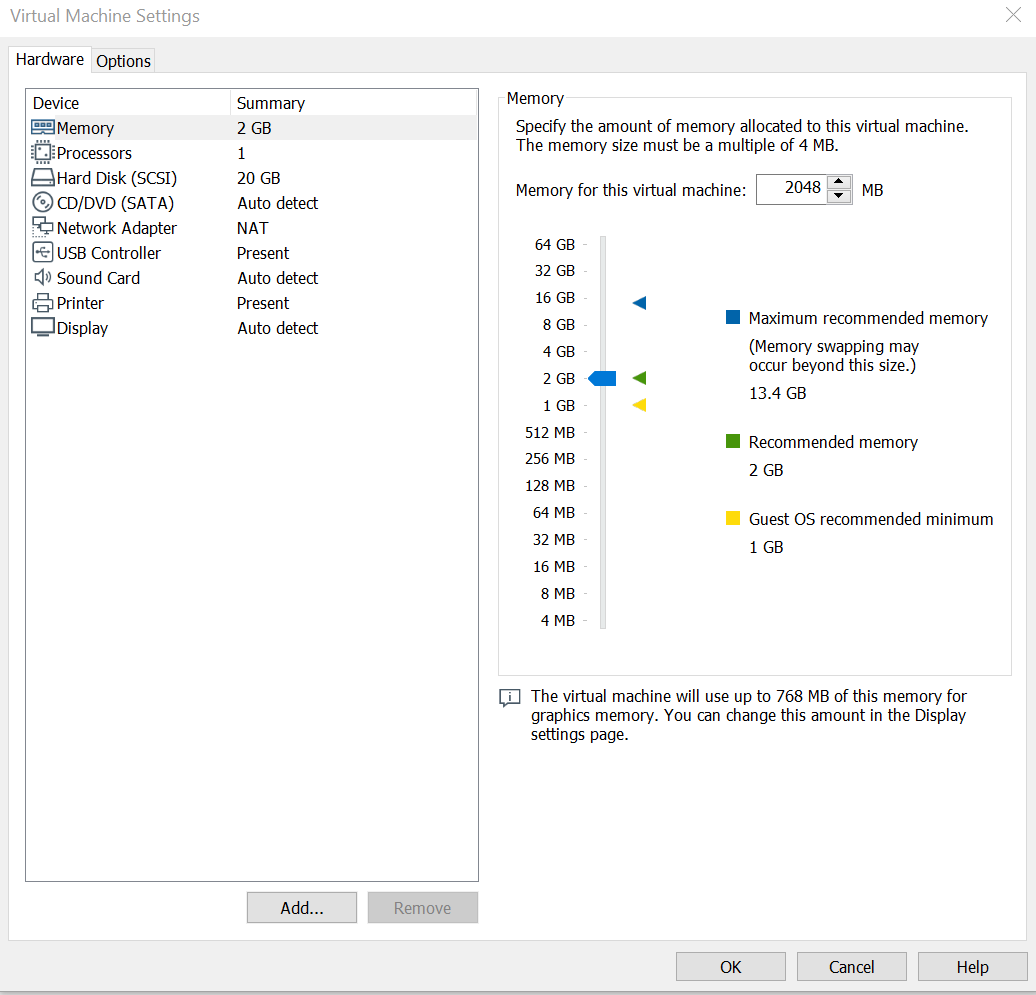
Once you have chosen both of these click on the Import button, and the VM should appear for you! Once you have the VM in front of you, click on the Edit Virtual Machine Settings, here is where the settings for the VM are. Below is an image showing what your VMs settings should be, if needed you can always turn down how much Hard Disk space the VM is taking up, as you would not need too much for this. Once checked out you should be good to go, by clicking Ok, and then click on Power on this Virtual Machine.
User Accounts:
For this lab, we will be using this main user, while switching between the others when needed. This lab will primarily only be using this specific user, however if you need access to the admin account (cyber user) it will be provided here as well. Do not give students access to this account however, as you will only need it in case of accidents occurring.
- cyber user - Administrator
- User Login:
CyberPatriot-Linux - Password:
patriotcyber123
- User Login:
What is Cron?
Some of the most monotonous things that you can encounter when working with systems are running multiple tasks over, and over again. Sometimes you would be wanting to run these commands at very specific times, potentially while you are not even there. However, there is a way you can combat this issue, and that lies with a service known as cron.
Cron allows you to schedule specific tasks at specific times, potentially only once, potentially every day for a week, month or year. You can potentially use Cron for various tasks such as Message of the Days that would list out your disk usage information, which may be helpful for a user to know, or possibly even send you reminders to go ahead and check to see if all of your programs and applications are up to date.
Cron overall, is a very helpful system service, and general, should not be something you would want to remove. Cron has two other services that are associated with itself, that being At and Anacron. While you may not see At any more, as it has mostly been depreciated, it can also run a specific task or program at a specific time. However, anacron is still very much used, and works alongside cron. Anacron can only be used on specific days, unlike how you can specify the exact time with cron. It also can “remember” specific tasks it missed, such as the system being turned off, causing them to be run upon the system regaining power again.
How do I start with Cron?
Cron is a daemon, meaning that it will only ever need to be started once
and will remain that way until you need to adjust it at all. In fact, if
you are running any linux distribution currently, chances are that you
already have Cron up and running, if you would like to check and see if
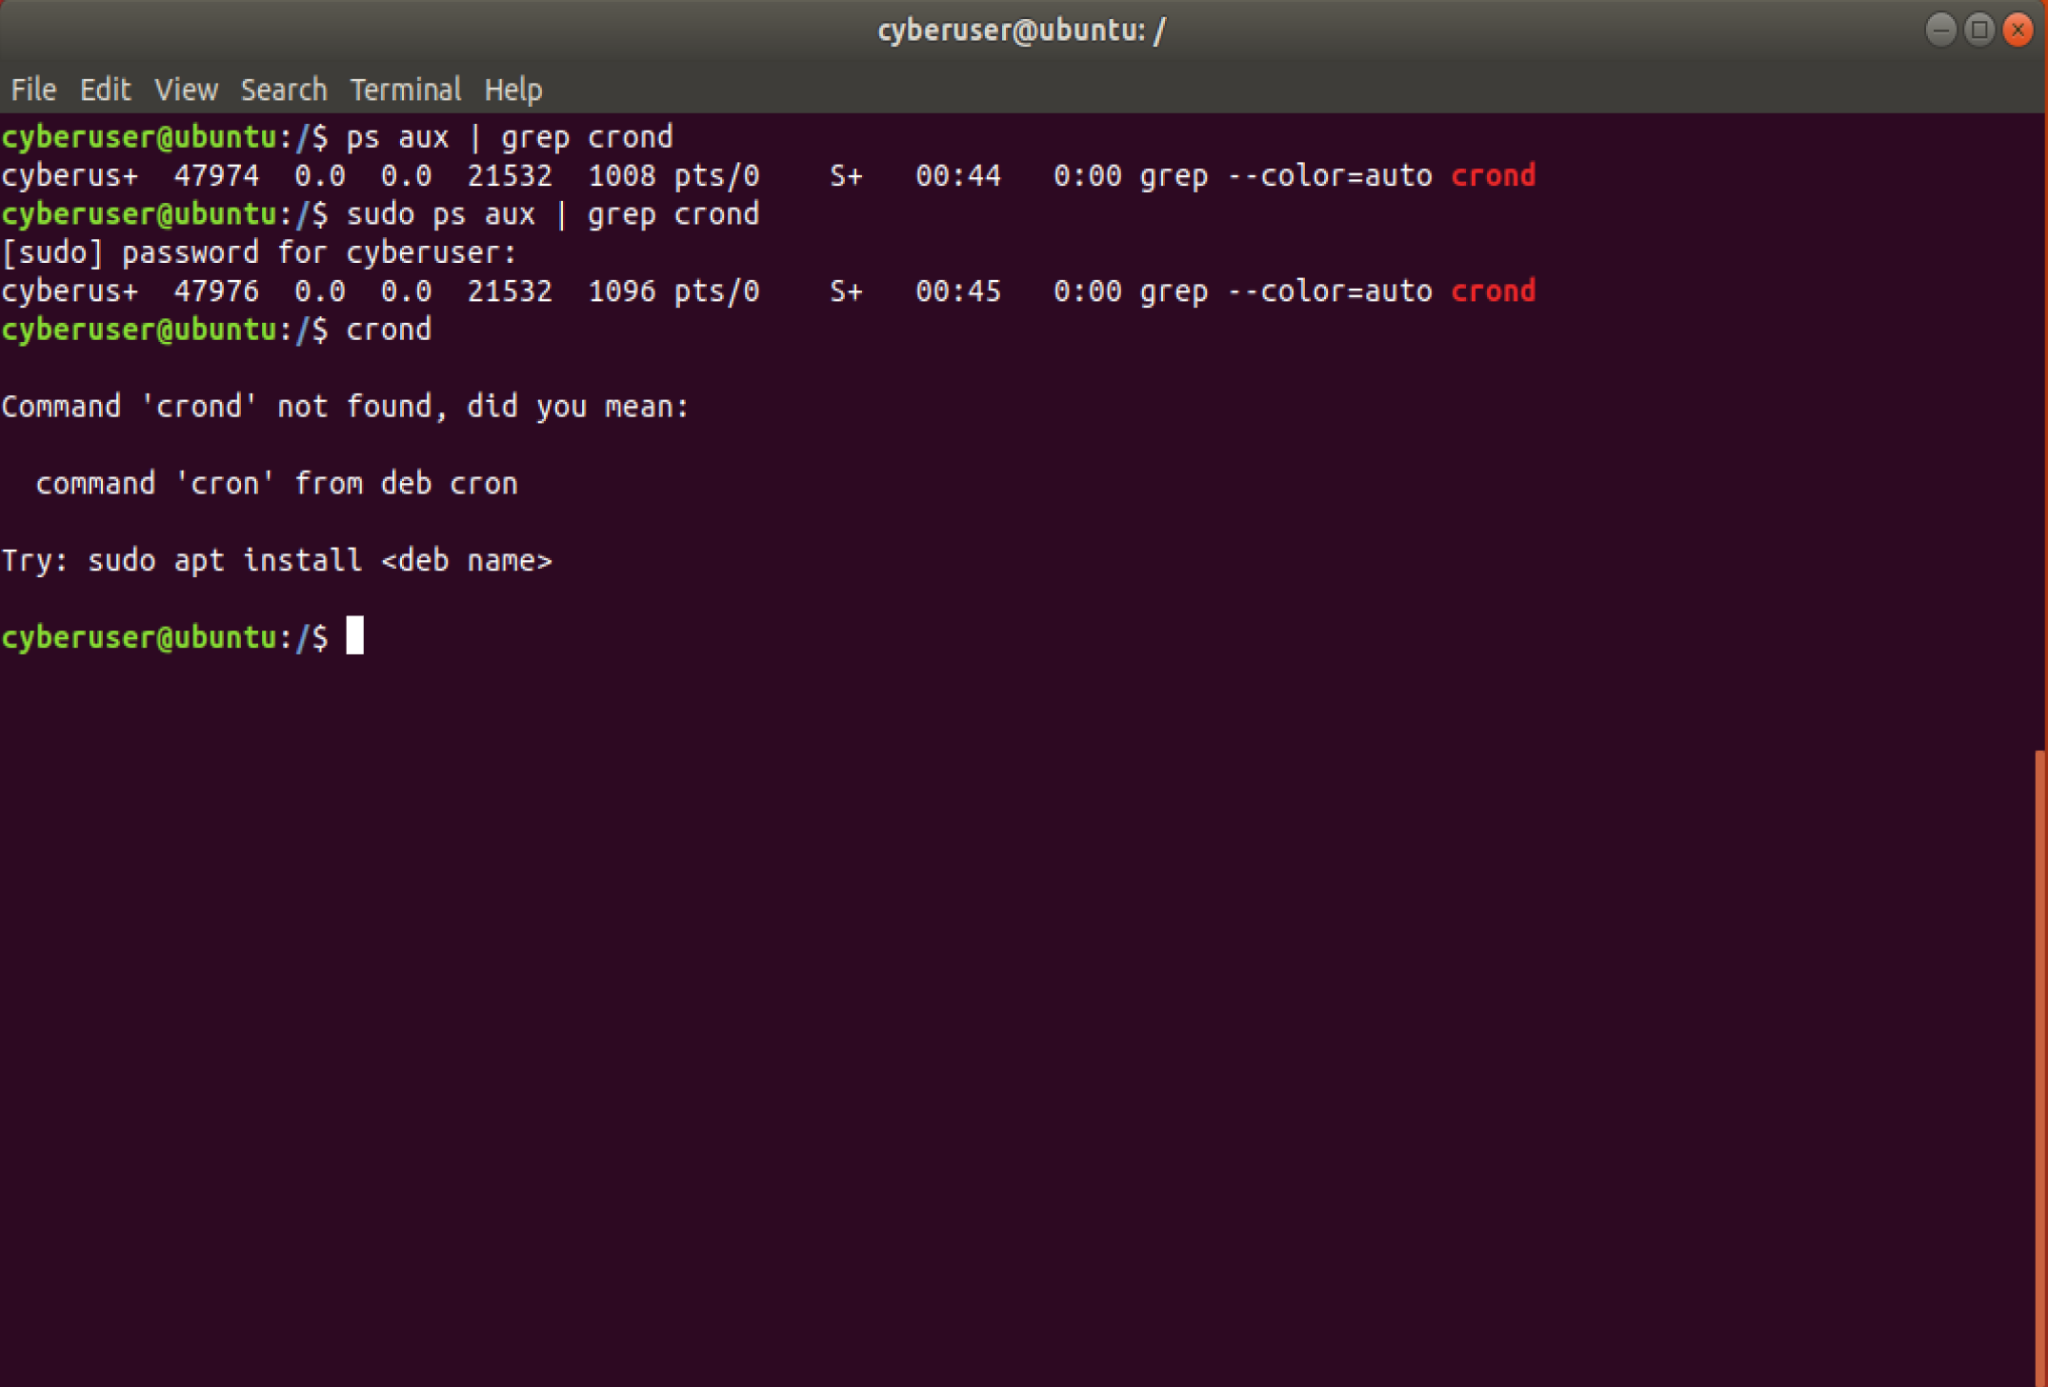
it is you can always run the command ps aux | grep crond. ps aux
shows all processes running for all users, and the grep crond part
means we are searching for the crond specifically. You should get an
output similar to the bottom image, if not, that means your crond is
not running, if you would like to fix that, running the command of
service crond start or /etc/init.d/crond start will start it up.
Just like any service, if you need to check its status, stop it, restart
it or enable it to always turn on at boot you can replace start with
status, stop, restart or enable respectively.
How do I use cron?
Much like how modular cron is in general, there are actually quite a few
ways you can get started working with cron and finding your various cron
jobs (Cron Jobs simply refer to the tasks that Cron executes). In the
/etc directory, you can find various other directories related to
cron, such as cron.hourly, cron.daily, cron.weekly and cron.monthly.
If you would want a cronjob to be ran at an hourly, daily, weekly or
monthly basis, you would put them within any of these directories.
However, if you do not feel like going into each of these directories
separately, or just want a bit more freedom when it comes to using cron,
you can always edit a crontab, which is the main config file for
cron. But first, how about we take a look at some of the crons that may
be present on our system at default. Go ahead and run the command of
cat /etc/crontab, you should get something like this as your output:

This may seem like a lot at first, but we will be going over every part
of this individually to get a full understanding of how cron is
operating. Besides the commented sections above, the first lines of text
here you see is the SHELL, which shows us the shell which cron will run
under, this is currently specified as being /bin/sh, however if not
specified, it will default to the /etc/passwd file. Next, is the PATH,
which contains the directories which will be used by cron, for example
if you have a program within a /usr/cyberuser/bin, you should
probably put that within your path, as you would no longer need to
specify the whole path if you would want to call it. There are two more
options that you could potentially put under here as well. That being
MAILTO and HOME. MAILTO allows you to specify what user will get the
output of each command, such as status reports or errors, if not
specified however, it will be sent to the owner of that cron. HOME is
the home directory for cron, this also uses /etc/passwd if not
specified.
Now for the next part of the crontable, you should see a bunch of *
characters in lines, followed by a user and then a command. Each part
here are the various field entries that make up the crontables. There
are seven entries in total here minute(m), hour(h), day of month(dom),
month(mon), day of week (dow), user and command. As we can see from
the example above here, we have a 17 * * * * root cd / && run-parts --report /etc/cron.hourly. From taking the information that
we know here, we can conclude that the first entry all the way on the
left stands for the minute. Since that is the only field that is filled
out, this means that the command is run at 17 minutes past every hour.
Taking another example, this time being the 25 6 * * * root test -x /usr/sbin/anacron || ( cd / && run-parts --report /etc/cron.daily ),
by looking at the fields filled out, we have the minute and hour, giving
us the information that this command is run daily at 6:25 am.
Before continuing, I should mention that for the hour value, it runs
on a 24 hour clock, so for example, if we wanted 6:25 pm, we would want
to use 25 18 * * * for our time fields.
Now that this is out of the way, we can continue interpreting the Crons
below. So far this has only covered daily tasks, however if we would
like to run a command every sunday for instance, it would look like the
example above once more, 47 6 * * 7 test -x /usr/sbin/anacron || ( cd / && run-parts --report /etc/cron.weekly ) tells us that every
Sunday at 6:47 am, this command will run. Another disclaimer, is for the
day of the week both 0 and 7 represent sunday! You could also spell out
the day of the week, meaning you replace the 7 with a Sun if you
want to run it every sunday.
For a monthly task, we look at the example once again and we can look at
the cron 52 6 1 * * root test -x /usr/sbin/anacron || ( cd / && run-parts --report /etc/cron.monthly ), which tells us that at 6:25 am
every 1st of the month, this command will run! However, lets say we
would want to run this command hourly on a specific day, such as the
15th of March, we could change the fields to be 01 * 15 03 *
so on this specific day, a command will run each hour!
Crontab is only one of many locations that you can try and find cron
though! Another common area that you can look for cron jobs is located
in the directory /etc/cron.d. By default, there should not be too
much here, only two files, that being anacron and popularity contest.
How about we go ahead with cat anacron?

Using the information we have gathered so far, we can determine that
this will be running at 7:30 daily, and it runs a command that affects
the anacron service. You may be wondering here what the main difference
between this and crontab is then? The main difference here is that
/etc.cron.d is populated with separate files that anyone can come and
view if they have the proper permissions. Crontab on the other hand only
manages one file per user, this makes it easier to manage the contents
of /etc/cron.d with a script while using a text editor would be easier
to manage crontab. However, I would suggest overall, that if you are
considering using cron.d, you may also want to consider using one of the
other directories such as cron.hourly instead. Speaking of, you can also
go ahead and take a look at the various files in cron.daily,
cron.hourly, cron.weekly and cron.monthly if you would like to see
more of the various cron tasks available!
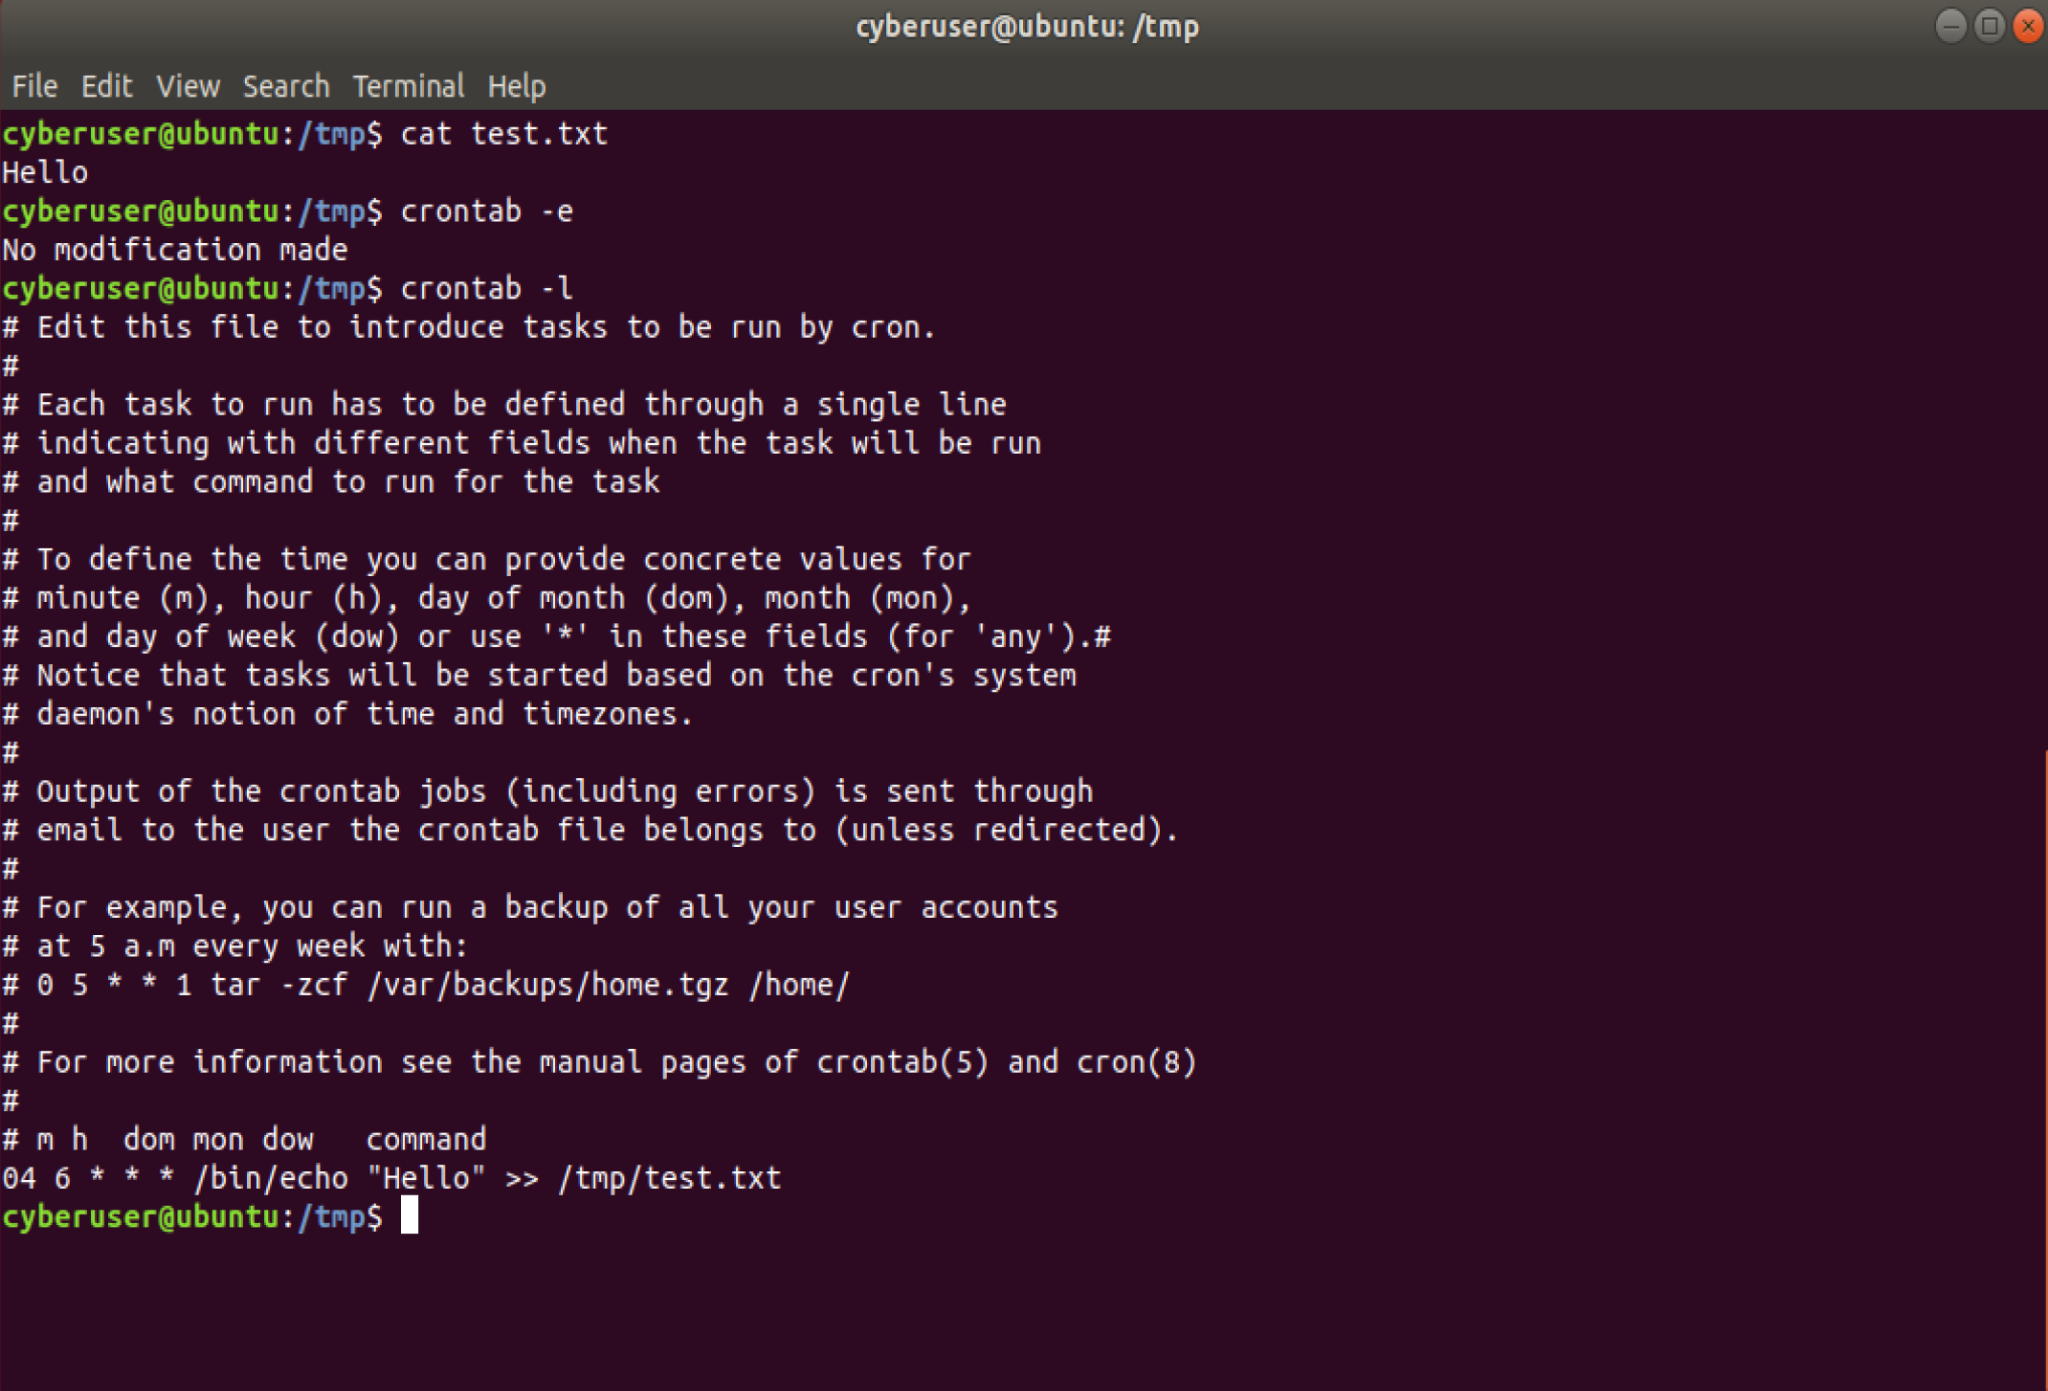
As mentioned above, crontab is managed by individual users, so if you
would ever want to go ahead and create a specific cron job for an
individual user, type in the command crontab -e to bring up the
editor. Here is where you can go ahead and create specific commands for
a user! For example, if you would want to have an echo happen on your
box at a specific time, you could do this here! For example if you ran
this, and replacing the XX with the hour and minute closest to you, XX XX * * * echo “Hello!” >> /tmp/test.txt you will get a
command that says hello to you within the tmp directory in a
text.txt file at that time! You can see an example below. Also below,
you can see the crontab -l command in action, this allows you to
list out all current cron for your current user! If you want to remove
your current crontab, crontab -r will do that. If you are a
privileged user, you can change other people’s crontabs with the
crontab -u <user> command! Lastly, if you want to change your
crontab editor, running either export EDITOR=<editor> or
setenv EDITOR <editor> will also work!
If you want to look at all individual users’ crontabs though, there is
an option! You will need to run this command however to do so, for users in $(cut -f1 -d: /etc/passwd); do sudo crontab -u $user -l; done. So what does this command do? Well for each user in the
/etc/passwd file, it will use crontab -u on that user and then list out
there crontab! However, you would need to have sudo privilege to run
this command! This is extremely helpful to see every user’s crontabs, as
you can potentially find mischievous tasks that may harm your system, or
a job that is simply not useful anymore.
What are Processes?
With any type of computer that you will work with, there exist processes. Processes refer to programs that are currently being executed, or a running instance of a program. There are two main types of processes that you will deal with while working within Linux, that being Foreground Processes and Background Processes. Foreground Processes are usually controlled via a terminal session, which is the reason why it also goes by the name of interactive processes, there must be a user connected to the system to start Foreground Processes. Background Processes are not connected to this terminal, and do not need any user input in order to work properly. Daemons also exist under processes, meaning that they will run forever as a service and they will not die.
So how do we go about finding what Processes will be running on our
version of Linux? Thankfully we have the ps command, a command that
stands for Process Status and will list out information to its user
about whatever processes are currently running. When you type this
command in normally, there is not going to be an output, you need to
specify one of two flags, that being -ef or aux. -ef will
list every process for you and gives you a full format, in other words,
giving you a large amount of information. aux on the other hand,
will do mostly the same as -ef but within a different syntax known
as BSD and give you some more information in regards to memory
usage.
How about we go ahead and try it out? ps -ef on your box and you
should get an output similar to mine:
below: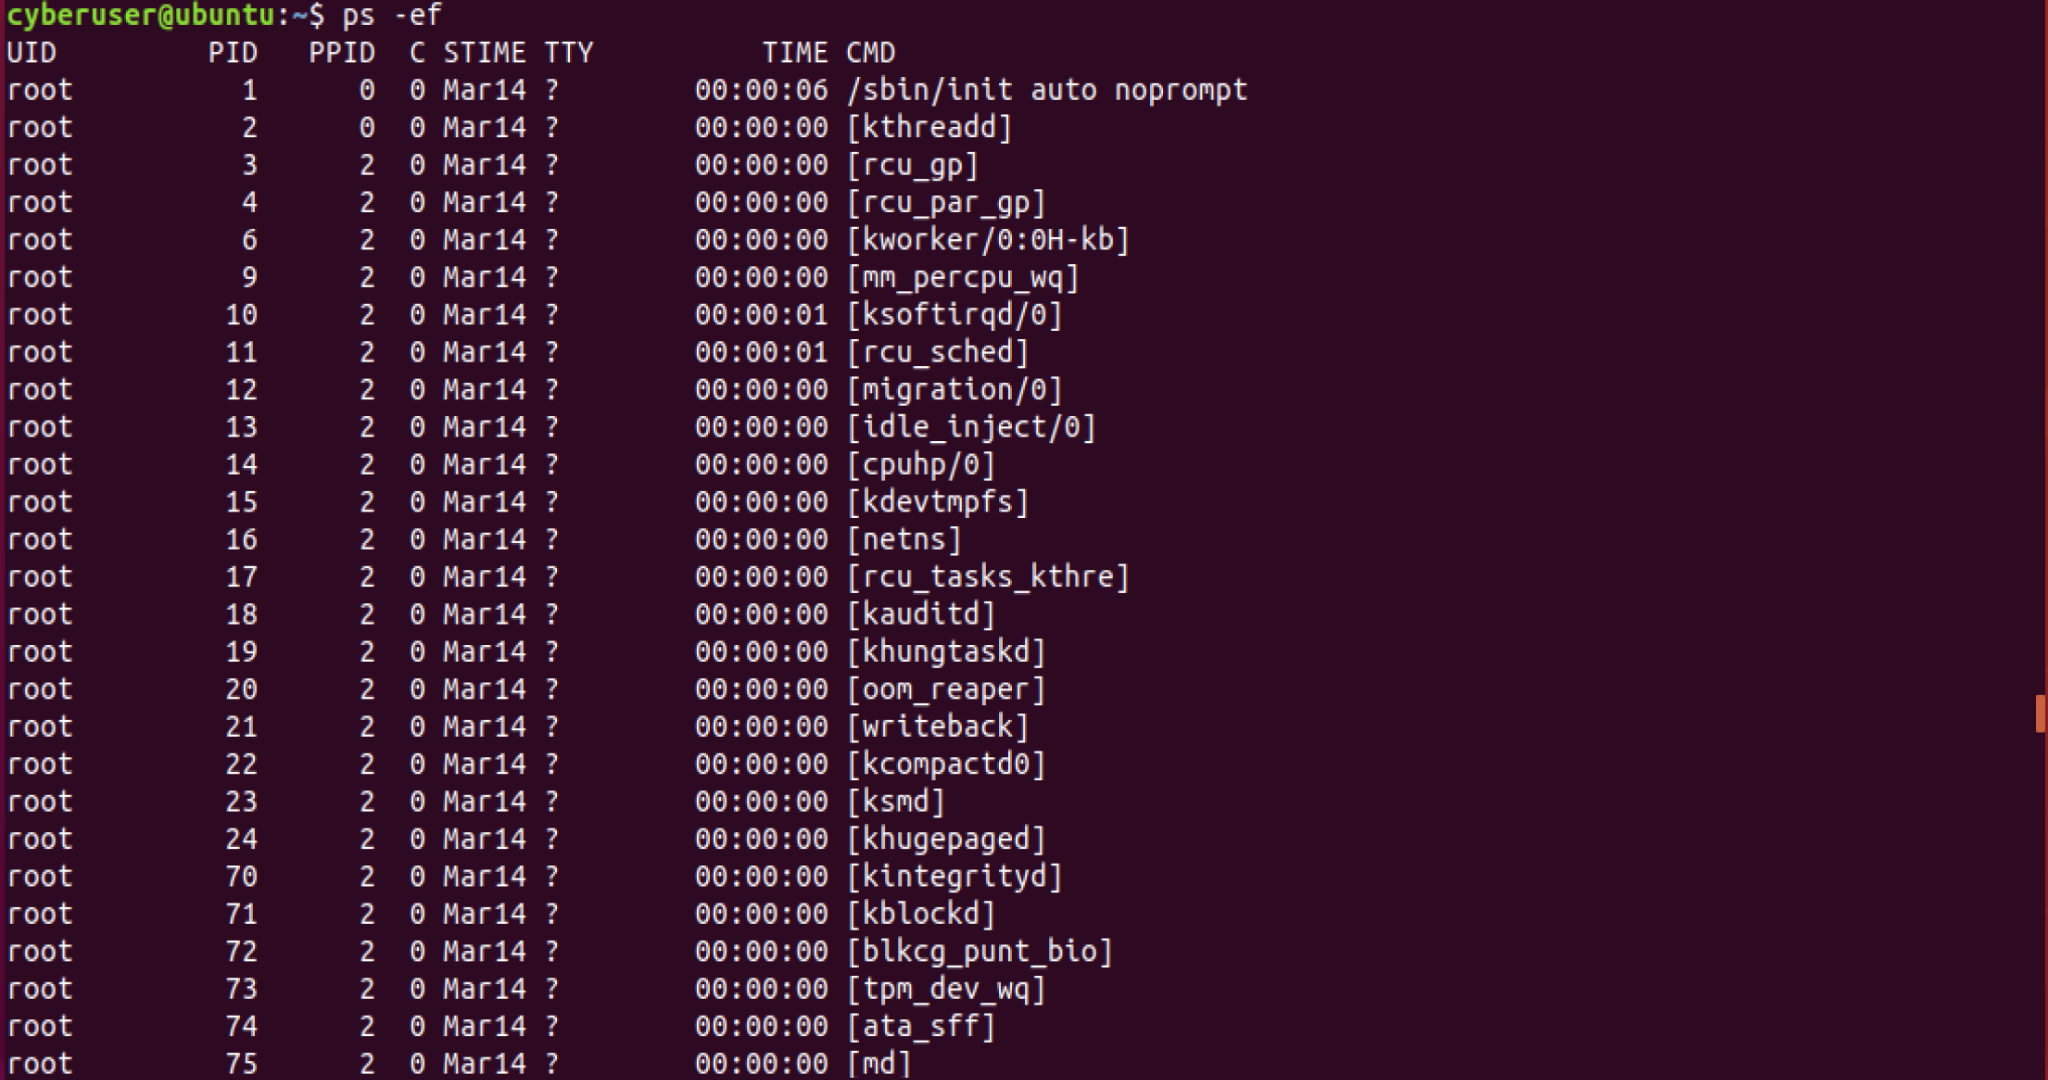
You should be getting quite the number of processes showing up! In
total, for this example you should be getting around 314 processes
currently running. Now this number is variable depending on the
distribution you are using, users present and other factors, no matter
the case you should always get a good idea of the amount of processes
running at a given time to make sure that you do not find anything
suspicious. According to some documentation found, there should be
around 203 running processes by default, which is close to the
number of just root processes being run, which is 205. You want
to do this to make sure your VM is as secure as possible, even when you
launch it at the first time, since you may find the presence of rootkits
within your machine which could be a major harm to the safety of your
device and possibly your network, The rest of the other usernames that
show up here, seem to show up no matter what. But how do we see the
amount of processes we have without needing to count all of them? By
running ps -ef | wc -l, it will give us the exact output of how
many lines are present within the output of our ps -ef, which is how
I got the number of 309!
To break down the information that you see here, from left to right, we
first have the user or the UID, which is the user that the specific
process is currently running as, if it is running as root, that means it
has privilege across all of your machine to run this process.. Next is
the Process Identifier, or the PID, all this is a unique number
given to a running process, however can be reused after a process dies.
PID starts with 1 and goes up from there. Next you have the PPID
or the Parent Process Identifier, this is a PID of the process that
created the process, a bit confusing at first, however there are no
unique numbers here. For example, if you see the PPID of 0, that
means that it was made by the kernel, in other words, made by the
machine at boot. STIME represents the start time of that process,
for the example above, it should be listing out the date instead of the
exact time, however that can change depending on when the machine was
started. TIME represents the cpu time, meaning how long that the
process has actively been used by the CPU, most of these default
processes should have quite a low number present, since most of these
processes are started and used at boot of your machine, so if you see
one that has a very long process time, it may be a bit suspicious and
should require you to take a deeper look into it. Lastly, we have
TTTY which is the name of the terminal or console that the processes
is being used under and lastly CMD represents the command line which
was used to start that processes, this can be changed to not be viewed
by users though, incase you would not want others to see it, mostly
through obfuscation techniques.
Now that we have a general understanding of what processes are, what if
we see one we do not think should be running? How do we get rid of that
process? Well it all depends on the type of processes that is currently
running once again. Starting with our first example, let’s type in
sleep infinity, this command creates a process that will simply do
nothing, forever. This is quite annoying as this is a user initiated
process, or a Foreground process. How do we get rid of this? By
pressing Ctrl+C, this will kill the process that is currently
running, as seen below:

What if you wanted to start a process, but you don’t want your console
to wait for it to stop working, that is where the & symbol comes in,
by adding this to your processes, it will have it run in the background!
Not only that, it will give you an output of that process’s PID.
Because we have that, we can end the process very easily by typing in
kill <PID>, however the user may not know immediately, as a
message won’t pop up in the shell right away, you would need to press
enter twice in order to see the message appear.

There are some instances when trying to kill a process, that the default
kill command would not work, this is because it defaults to
SIGTERM, which essentially gives the process the choice to close
itself or not. This is dangerous because, if you have a malicious
process running, it may choose not to terminate itself, meaning the only
other way to get rid of this process from running, is to use
SIGKILL, which removes the choice of the process and terminates it
instantly. You activate this by using the flag -SIGKILL after the
kill command.

Typing kill over and over again is a bit overkill, thankfully there is a
way to speed up this process a bit. killall will work just like
kill, but uses the process name instead of PID. So for instance, it will
kill all of our processes that have sleep present. You need to be
careful running this command however, as if you do not know how many
commands are identified by that process name, you could unintentionally
kill more processes than you intend, sometimes important ones.

ps is a very helpful command to get quick information about the
processes running, however there exists more commands out there if you
need specific information. For example, the top command will give
you real time information about the process usage and resource
utilization of your machine. By default, this spurts it by CPU usage, so
you can see quickly what processes may be slowing down your system,
another way of finding potentially malicious processes present on your
system.
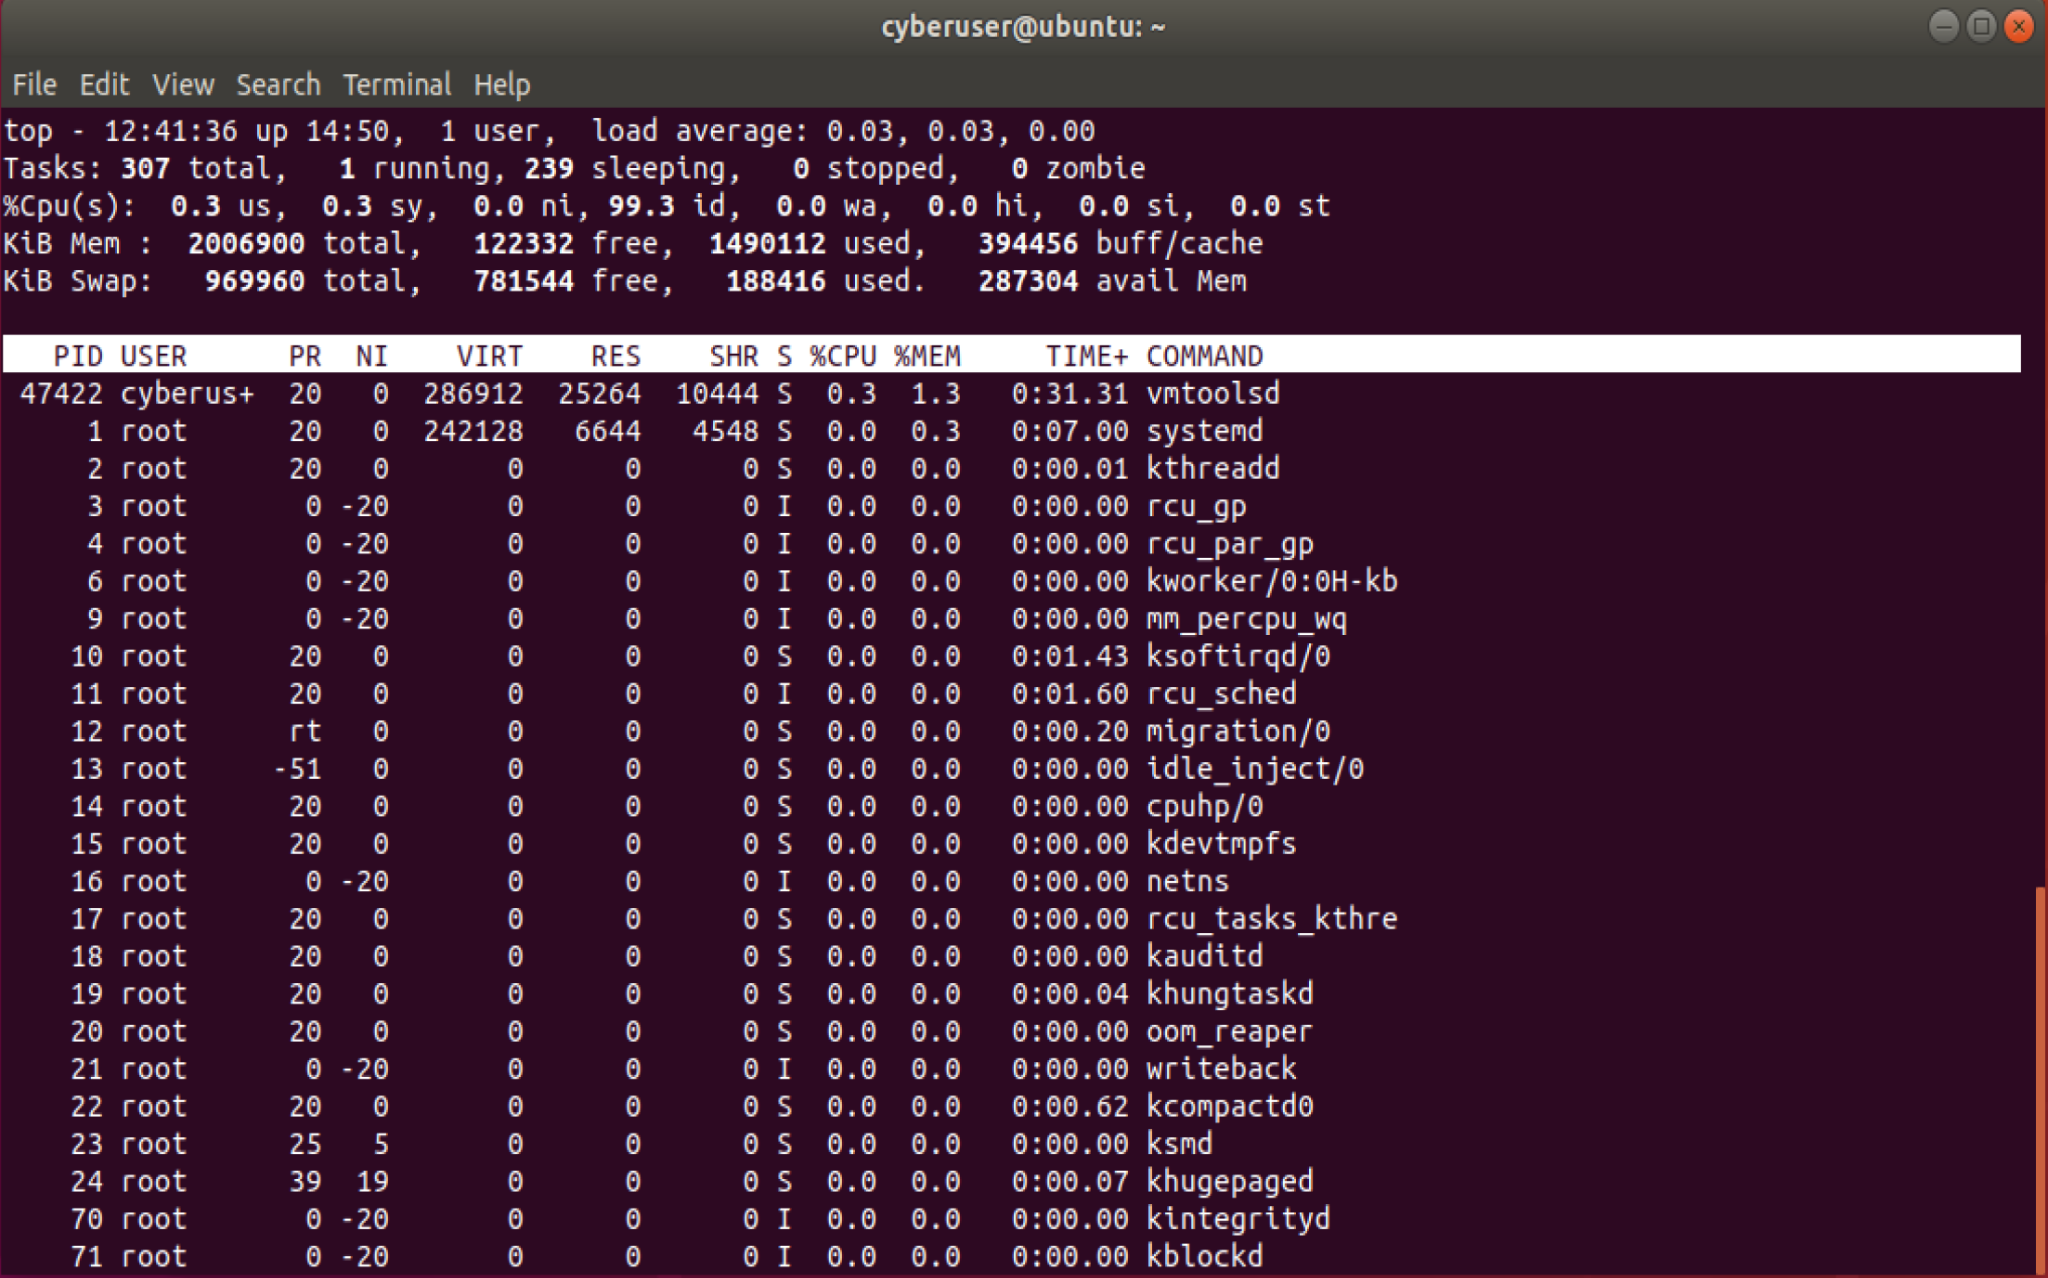
Above, you should see the line %Cpu(s), this is where the overall CPU
usage is shown and is divided into us, or the user space, sy,
the system usage spent on kernel space, and then finally id, or idle
CPU usage, this will show you the % of your CPU that is currently not
being used, and is another great way to tell if your CPU is under heavy
stress currently.
The line below that is showing us the total amount of system memory being used as well, all in KB format. The first number is the total amount of memory that we have present in Kilobytes, next is the amount of free memory available to us, then the amount of memory being used by applications. However when the second and third number are added together, it doesn’t add up to our first number. This is because the rest of the memory is being used by the kernel to cache recently used files, so if we need to use them again, it will be available to us right away. Also looking down to the processes overall, you can see how much CPU capacity specific processes are taking up, and the amount of CPU time that it has been used.
If you ever encounter a situation where your system gets compromised, you should not immediately trust these programs. They are quite useful, but an adversary knows that as well, meaning that they can easily replace these commands with something nefarious. You should check your executables and see if they match the executables on a trusted system, that or run these executables from a read only drive. Sometimes, you cannot fully trust everything on a system once compromised however, causing an offline analysis to be done.
What are Services?
By default, your linux machine should have plenty of services up and running including cron, login, remote login, file transfer, DNS, DHCP and so many others that we can list! Technically, all services are just a process or a group of processes that run continuously within the background of your machine. This can also be known as daemon, as we have talked about earlier within this lab!
In most modern systems of Linux, the way that we manage most services is
with the process manager systemd. This can control services to
start, stop, restart, show its current status, or also
enable auto start at boot for that service. systemd replaces the
init process that had been used previously.
In order to properly use systemd, the command systemctl is used!
In order to list out all of the current services that are loaded onto
our system, meaning that they can either be active or not, you would
want to type in systemctl list-units --type=service.
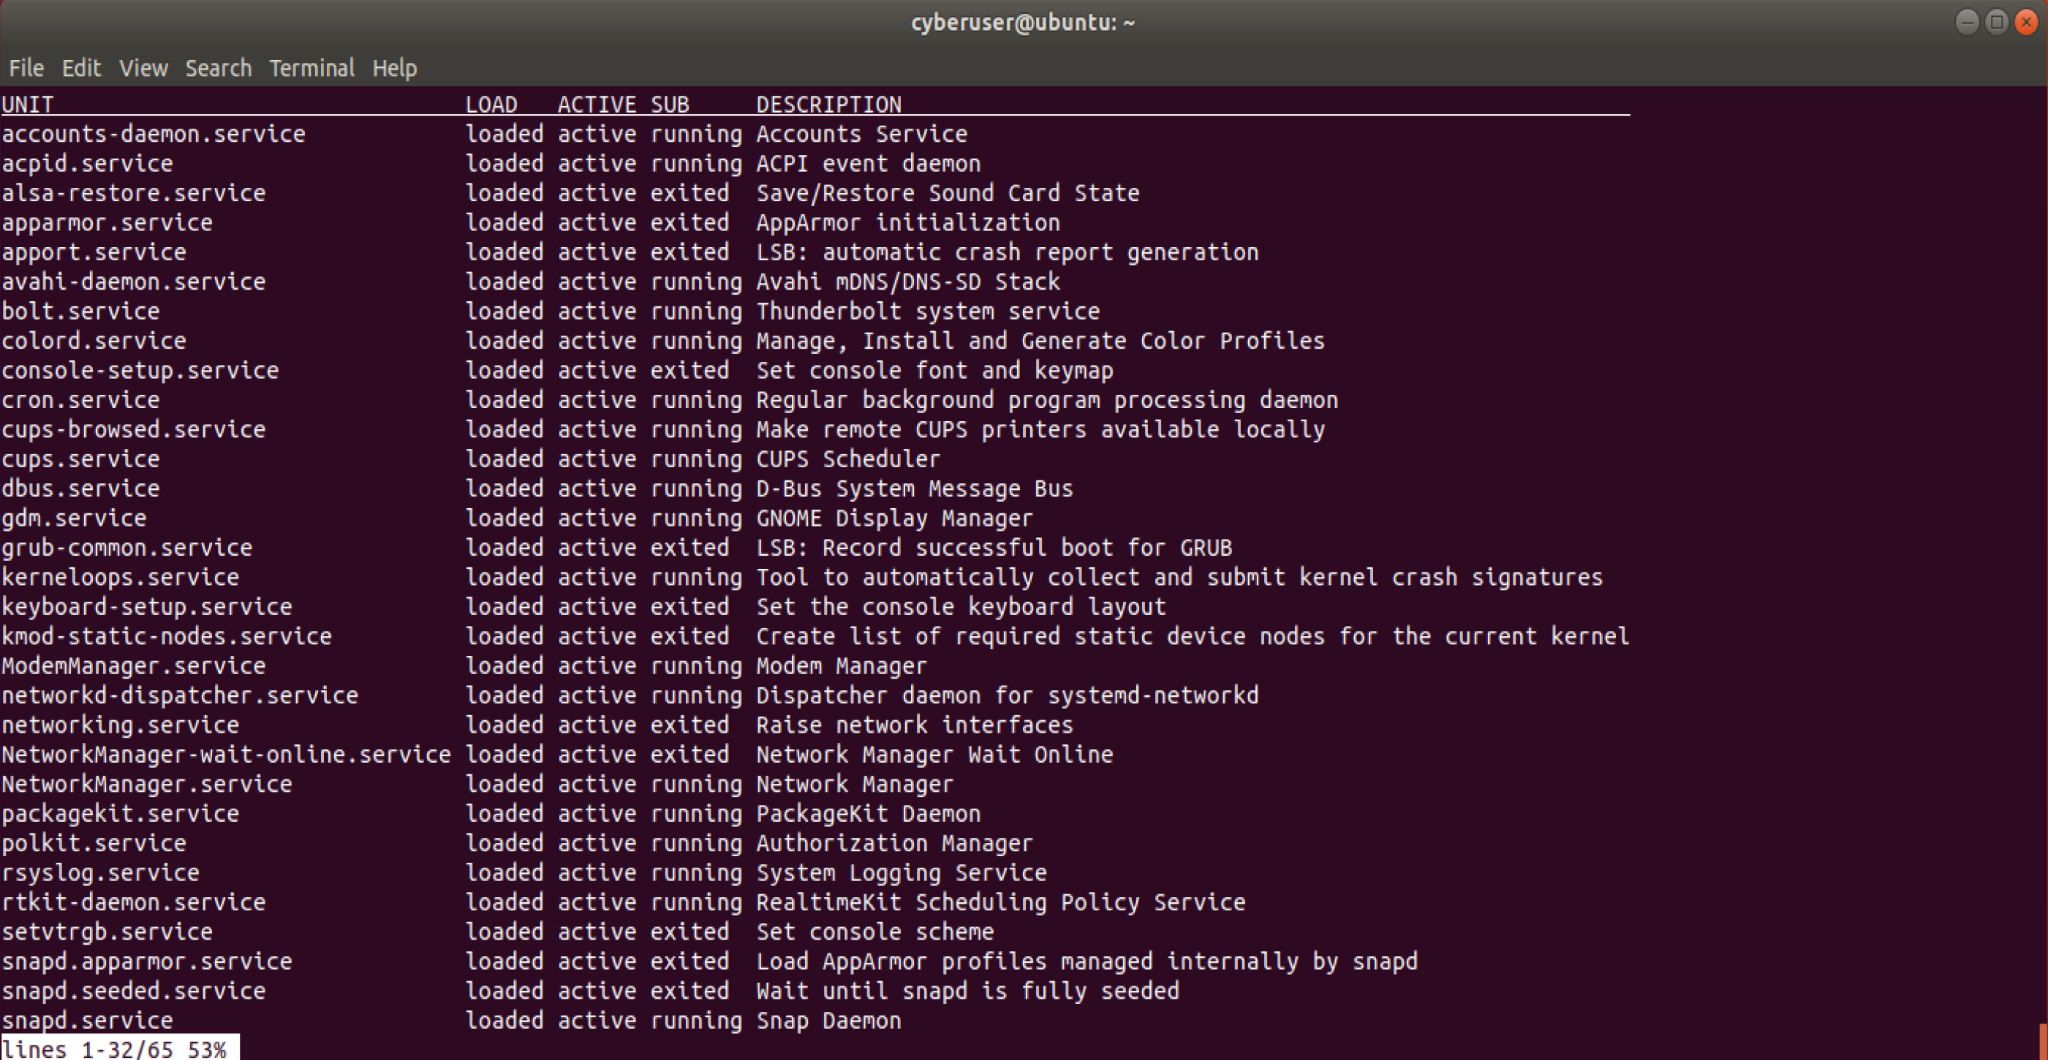
From the example above, we can see all the various services that are running. Most of these services listed are loaded onto our system, not only that, but they are active as well! The only main difference we may see between services, is whether or not that is running or they are exited.
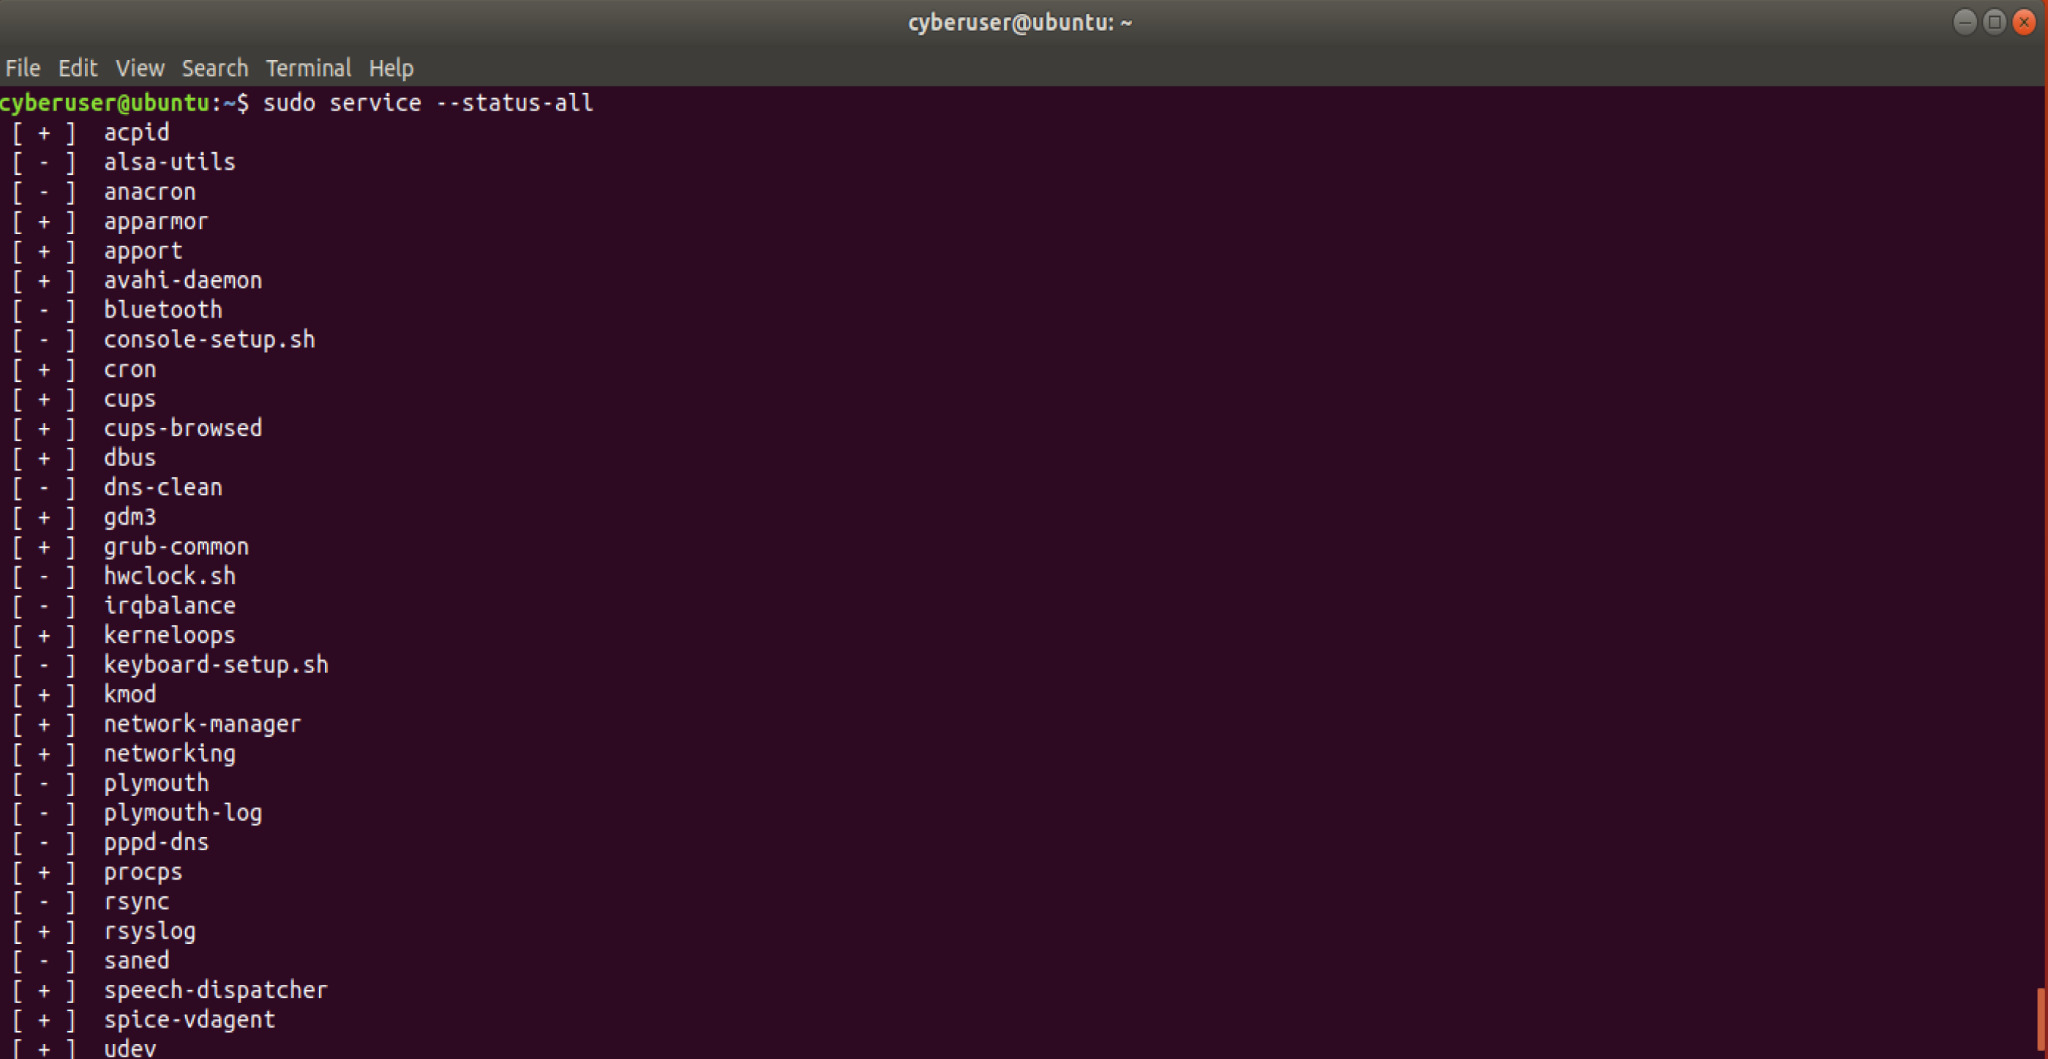
Another way to check what services are running, is to use the
service command, if we run sudo service --status-all, it will
list all services loaded onto our system. You can tell if they are on or
not by the + and - symbols that appear. + shows that they
are on while - shows that they are not running.
Despite us seeing all of these active services, it may be hard to tell
how dangerous they can be to our system, that is why we also check to
see what port they are using/listening on. Most of the time, you do not
want a lot of services running that leave ports open on your machine, as
you do not want to leave your system vulnerable. That is why we use the
netstat command to show us what services are running on what
specific ports. We use certain flags when using netstat however, -l
list out all listening sockets, -t displays all tcp connections,
-u shows all UDP connections, -n prints numeric port numbers and
-p shows application name. So overall, the command should look like
netstat -ltup!
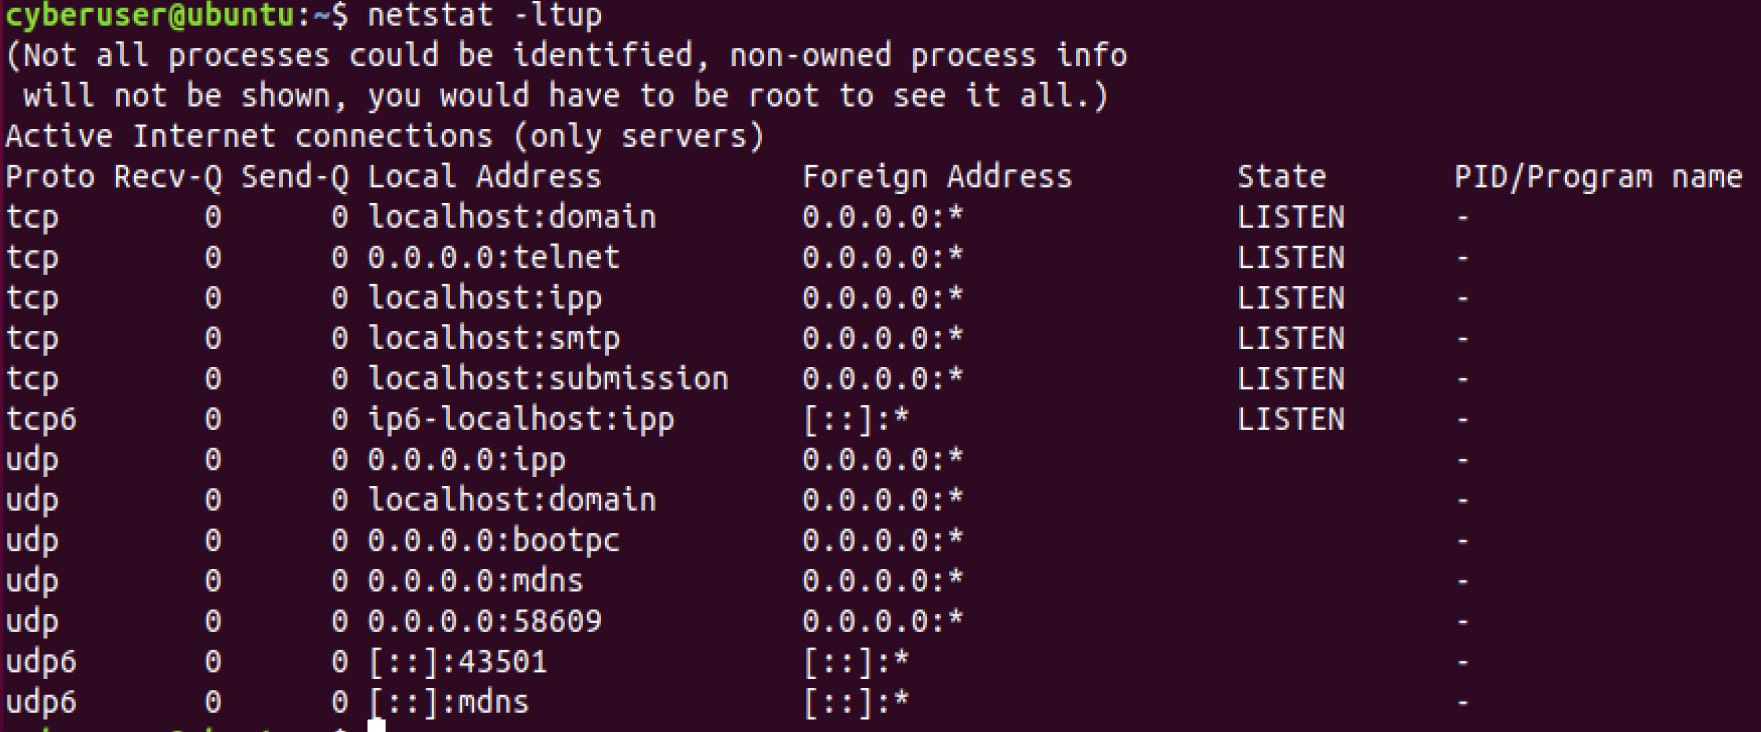
On this machine, there are two services that are running that are
considered dangerous, that being sendmail and telnet. While
sendmail has a purpose, if you do not 100% know how to use it, you
should not be using it as there are a lot of security holes within it
that can be dangerous for your system. telnet has no security
measures built into it when you use it to transfer data over a network,
meaning everything will be in plain-text. If someone were to use a
packet sniffer, they would be able to see sensitive data such as
passwords. We should go ahead and stop these services immediately! To do
so systemctl stop <service> should be the command you use, the
service for sendmail is sendmail while telnet is known as inetd.
You may want to search for them first under your services or your
netstat before turning them off so you can get an idea what to look
for!
How to show mounted drives?
Looking at mounted devices on your machine is very helpful! Since unix
systems have a single directory tree, all accessible storage must have
an associated location within the directory tree. Windows has one
directory tree per storage component, or drive, that is why the process
of mounting is so important. We can associate a storage device to a
particular location in the directory tree, for example when booting, a
storage device known as the root partition is associated with the root
of the directory tree, which is the first / we see when changing
directories!
Because of the way this is set up, getting a good look at all of the
mounted devices that you have on your machine helps keep track of your
system. There are multiple ways to do this, however the two I will cover
will give you a lot of information to work with. The first one being
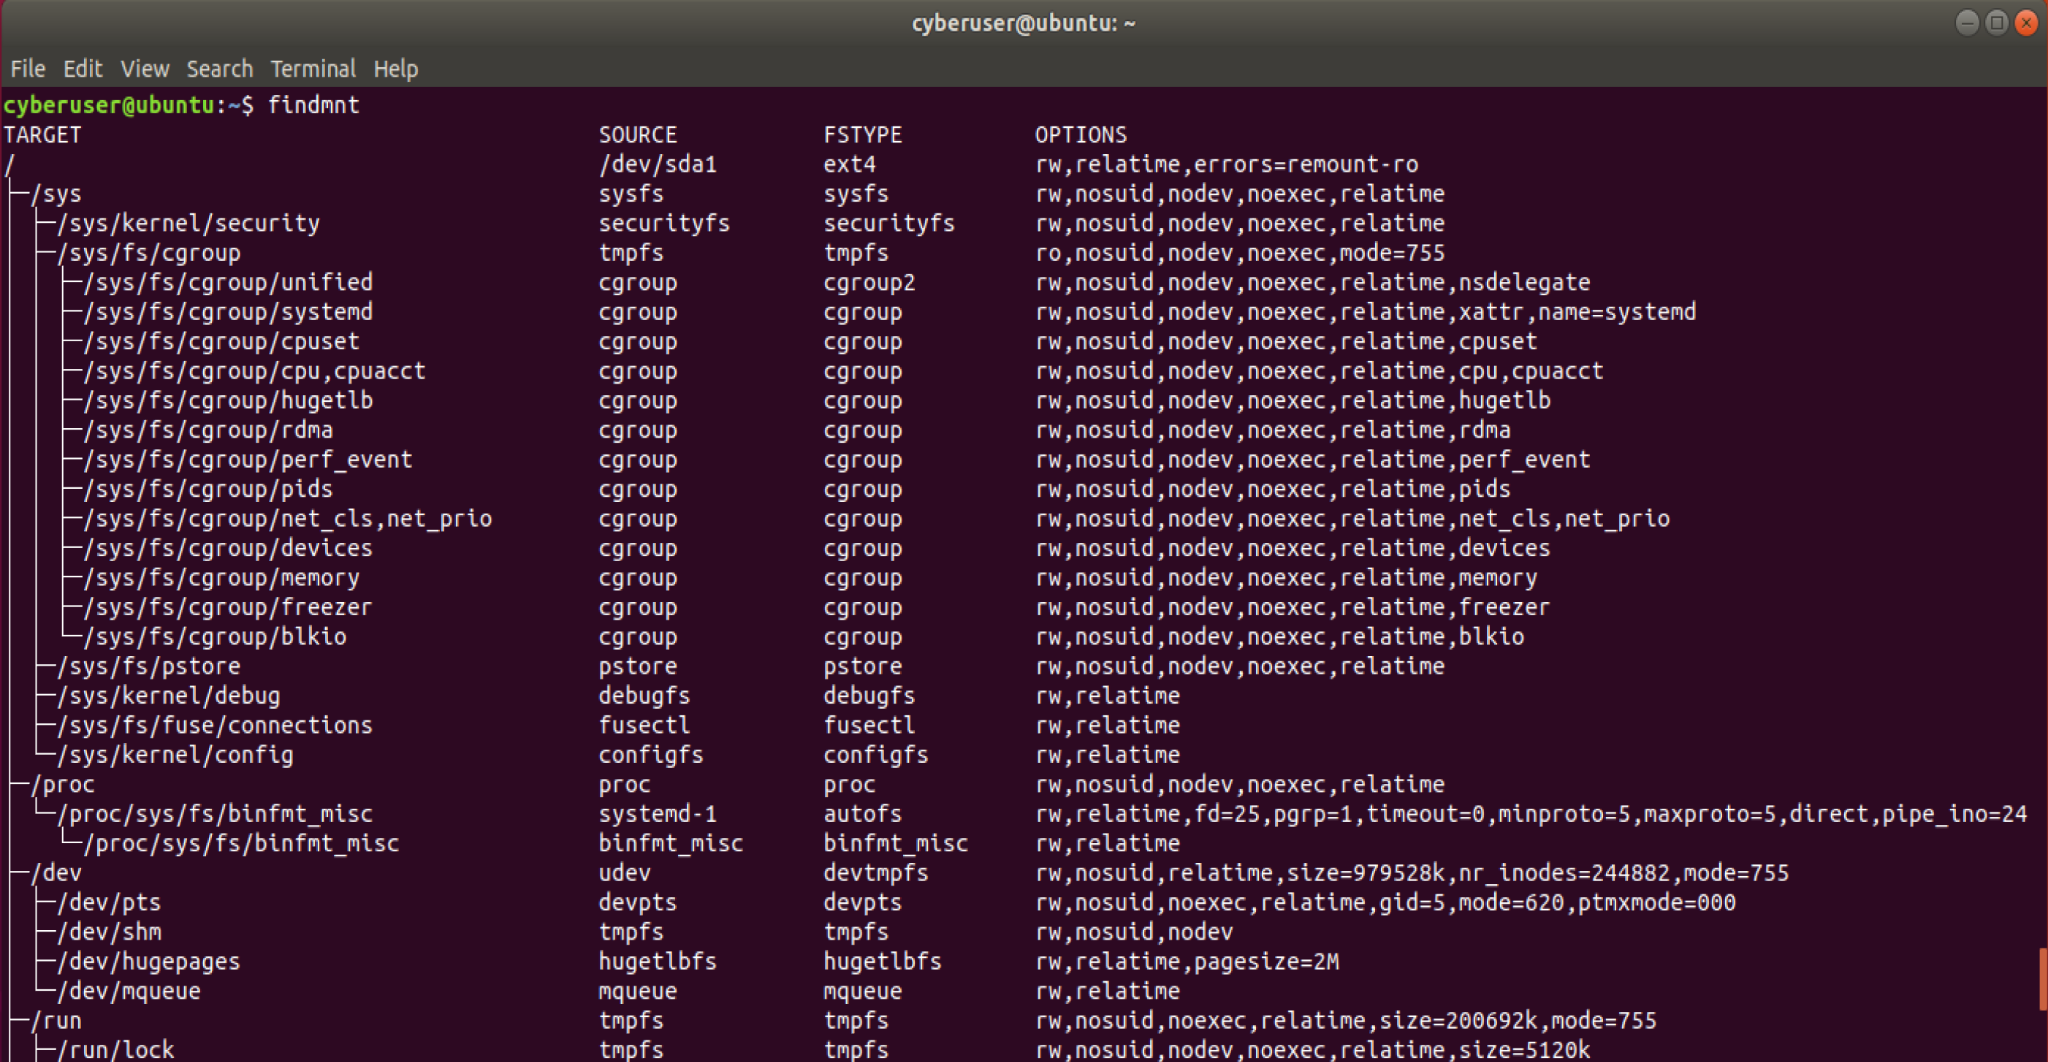
findmnt, this will list all of the mounted filesystems or search for
a specific file system. This prints it in an easy to read tree format,
making it easy to track all of your mounted devices. You can even output
this into a JSON file if you would want to! I also like the command
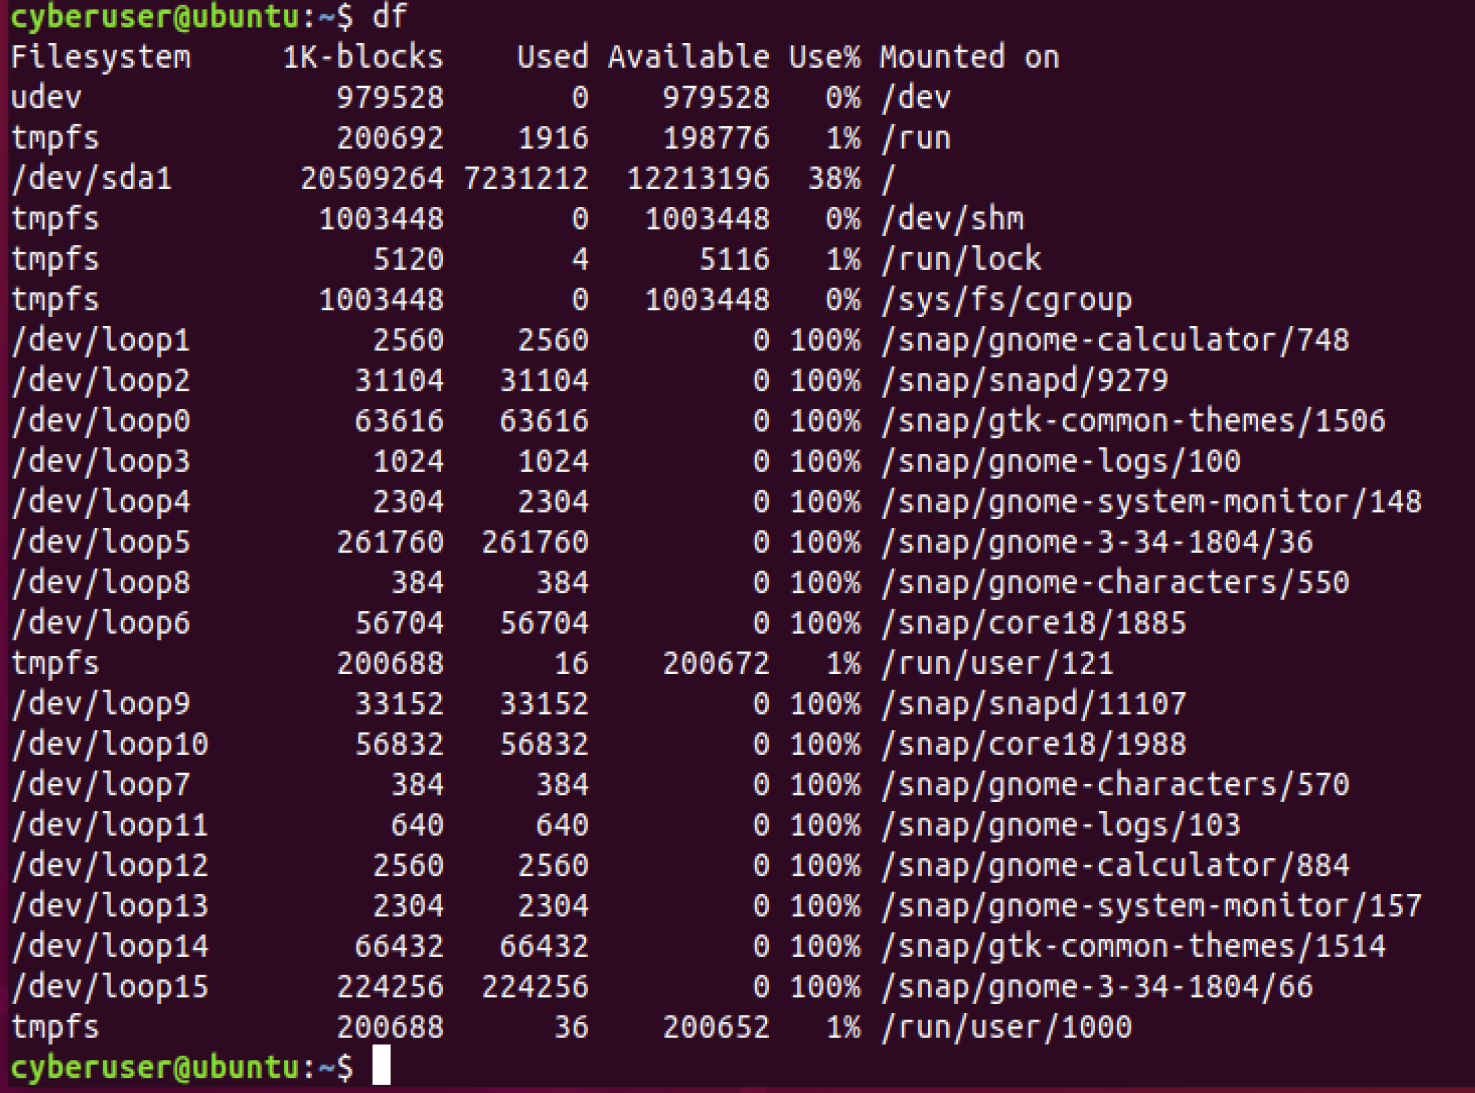
df as it will report to you the file systems disk usage space if you
would ever need to check and see which device is using up the most
space, or how much is available to you. This is great for monitoring
your system, as if you see a spike in one of them where it wasn’t the
other day, you may have a malicious entity within your system.
